Monte Carlo Simulation for Traders: Estimating Drawdown and Risk of Ruin
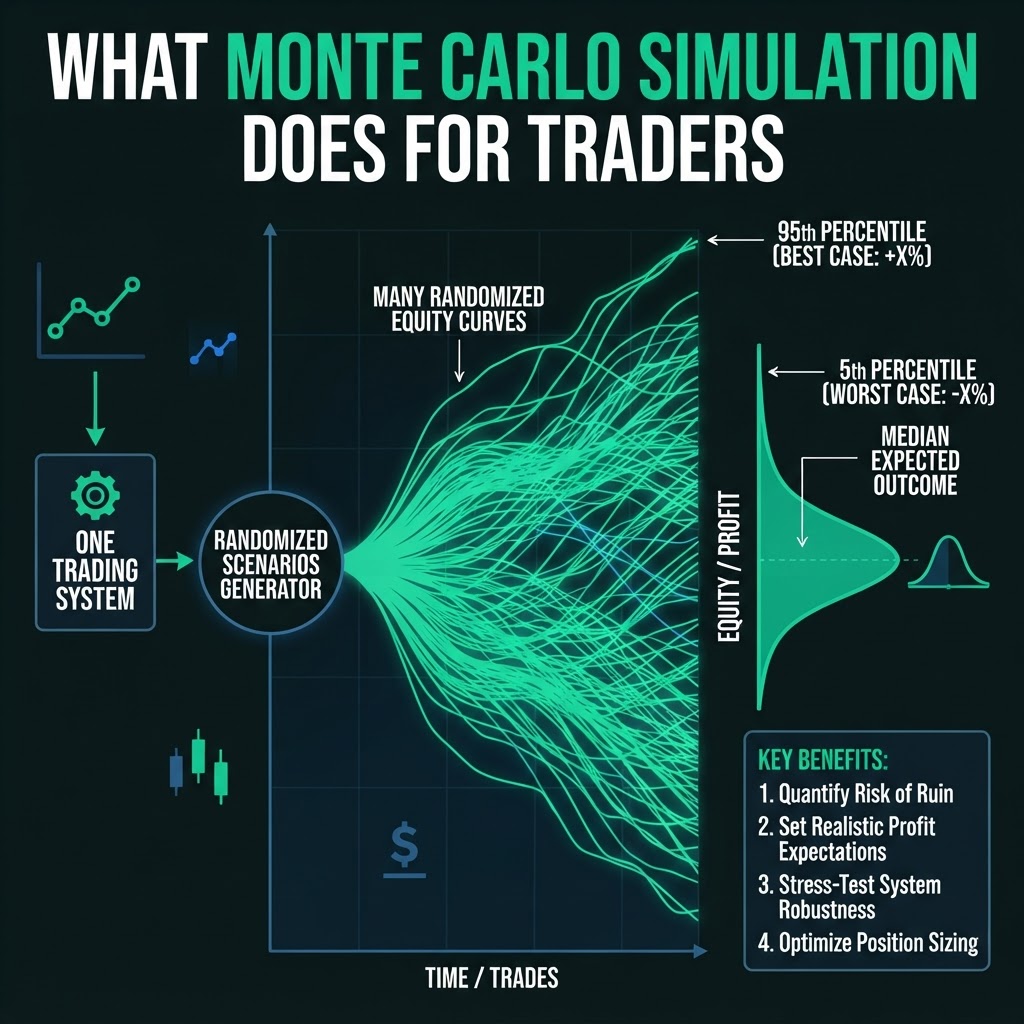
Monte Carlo Simulation for Traders: Estimating Drawdown and Risk of Ruin
Beyond the Single Backtest
A backtest shows one historical sequence of trades. Even if its expectancy is realistic, the same wins and losses could have arrived in a different order. That sequence changes the depth and timing of drawdowns, which affects both capital survival and trader behavior.
Monte Carlo simulation creates many alternative paths by reshuffling trades or sampling from an estimated return distribution. It does not predict the future. It estimates a range of outcomes consistent with the assumptions.
Sequence Risk
Consider a system with 60 winners and 40 losers. In the backtest, losses may be evenly distributed. In live trading, eight losses could occur close together. The total set of outcomes is similar, but the emotional and financial experience is very different.
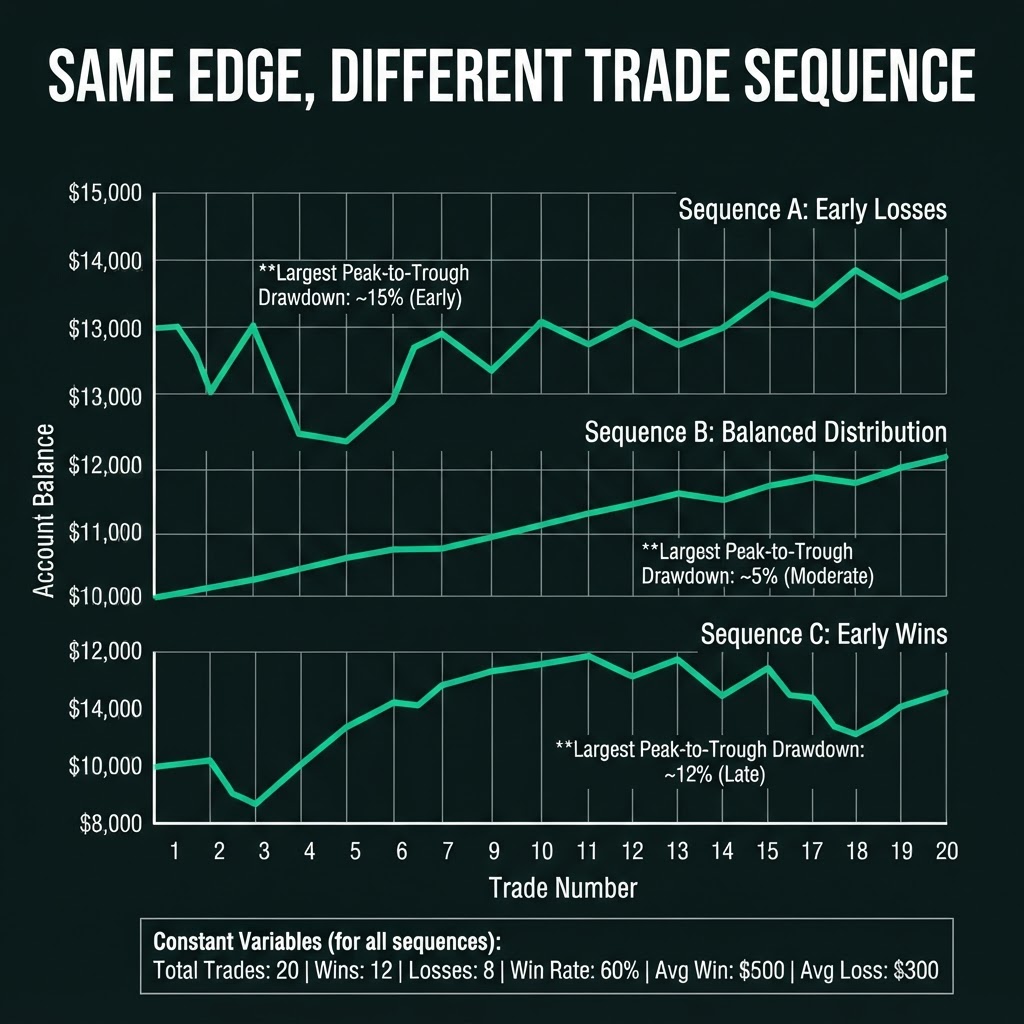
This is sequence risk. A strategy can have positive expectancy and still experience a severe losing streak. Risk management must be designed for difficult paths, not only the average path.
Reading the Results
Run thousands of simulations and collect metrics such as ending equity, maximum drawdown, longest losing streak, and risk of falling below a chosen capital threshold. The distribution is more useful than the best or worst isolated path.
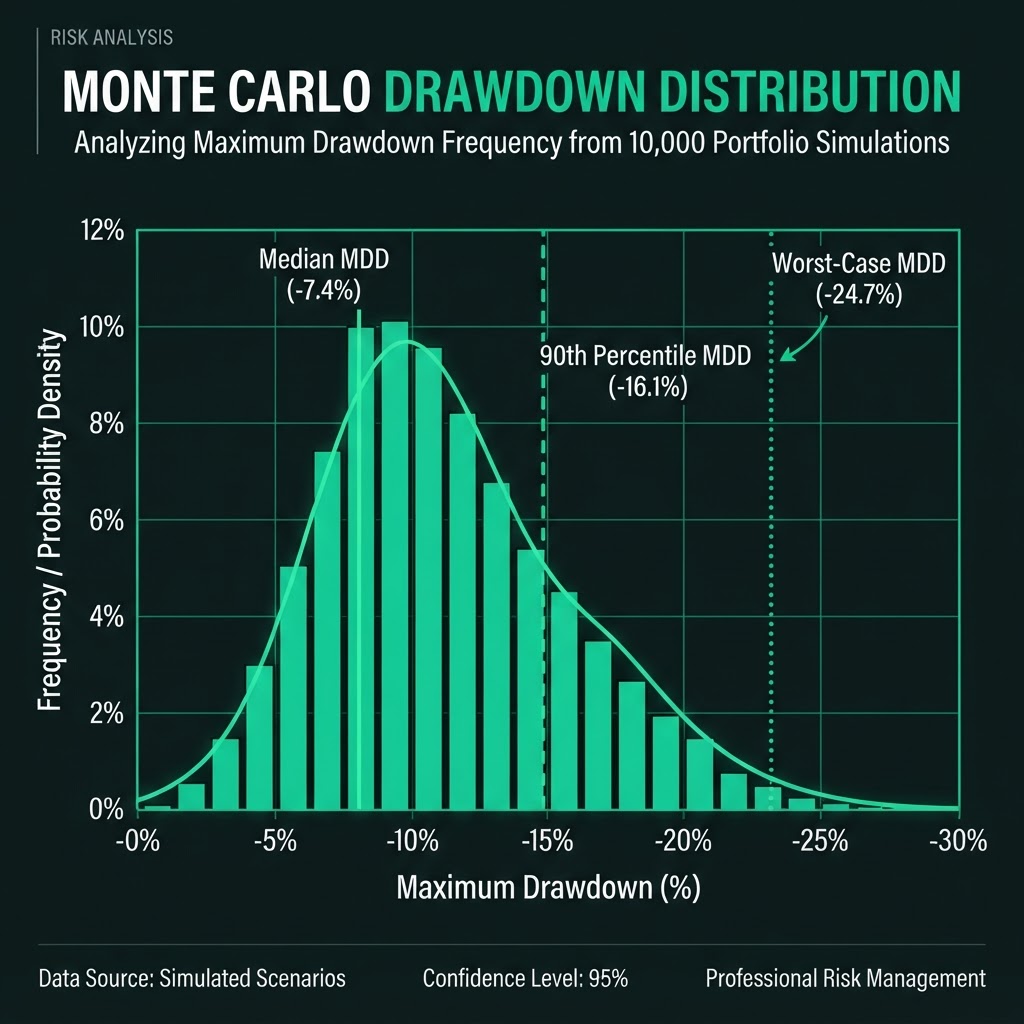
The median describes a central outcome. A 90th- or 95th-percentile drawdown offers a conservative planning figure. Results depend entirely on the input data; a short or overfit backtest will produce false precision.
Turning Results into Position Size
Suppose a one-percent risk per trade produces a 95th-percentile drawdown of 32%, but the trader can emotionally and financially tolerate only 20%. Reducing risk per trade may bring the simulated drawdown within that limit.
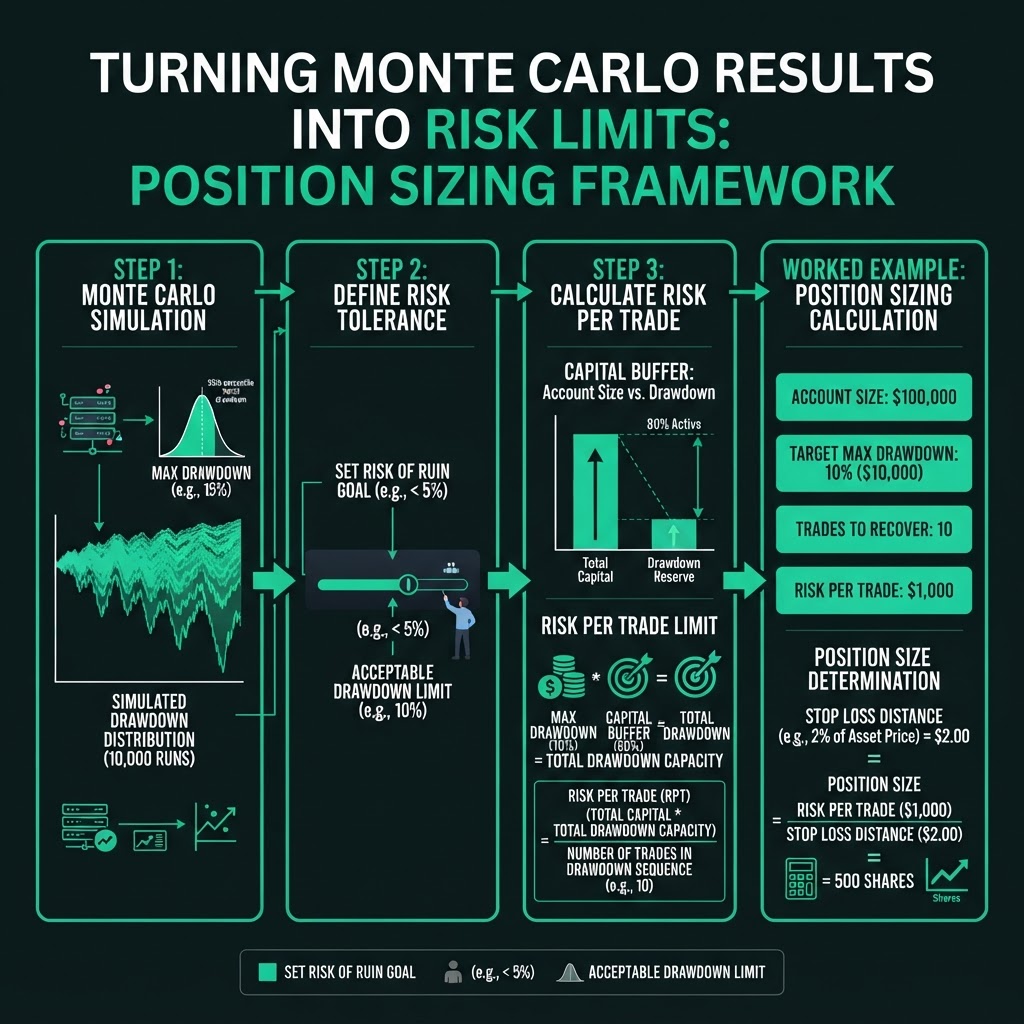
A practical process is:
- 1Define the maximum tolerable drawdown.
- 2Simulate the strategy with realistic costs.
- 3Review adverse percentile outcomes.
- 4Reduce risk per trade until the drawdown fits.
- 5Keep a capital buffer for model error.
Risk of Ruin
Risk of ruin is the probability of losing enough capital that continuation becomes impossible or impractical. It rises with larger position size, lower expectancy, higher outcome variance, and correlated exposure. A very low modeled probability is desirable, but it is never truly zero because market behavior can change.
Limitations
Basic reshuffling assumes future trades resemble historical trades. It may not capture regime shifts, changing spreads, execution failures, or clustered performance during crises. Block sampling and stress scenarios can improve realism, but judgment remains necessary.
Final Takeaway
Monte Carlo analysis replaces confidence in one smooth equity curve with a probability-based view of uncertainty. Use it to set sustainable risk, prepare for losing streaks, and decide whether a strategy's likely drawdown is acceptable before capital is committed.