How to Use the COT Report for Forex Market Bias

How to Use the COT Report for Forex Market Bias
What Is the COT Report?
The Commitments of Traders report is published weekly by the U.S. Commodity Futures Trading Commission. It summarizes open futures positions held by different participant groups as of Tuesday. Currency futures positioning can offer a useful view of sentiment behind major forex markets.
The legacy report separates traders into commercial, non-commercial, and non-reportable categories. Commercial participants often hedge business exposure. Non-commercial participants include large speculators such as funds. Non-reportables are smaller traders whose positions do not meet reporting thresholds.
Calculating Net Position
Net position is simply long contracts minus short contracts. If large speculators hold 120,000 longs and 80,000 shorts, their net position is +40,000 contracts. A negative result means net short exposure.
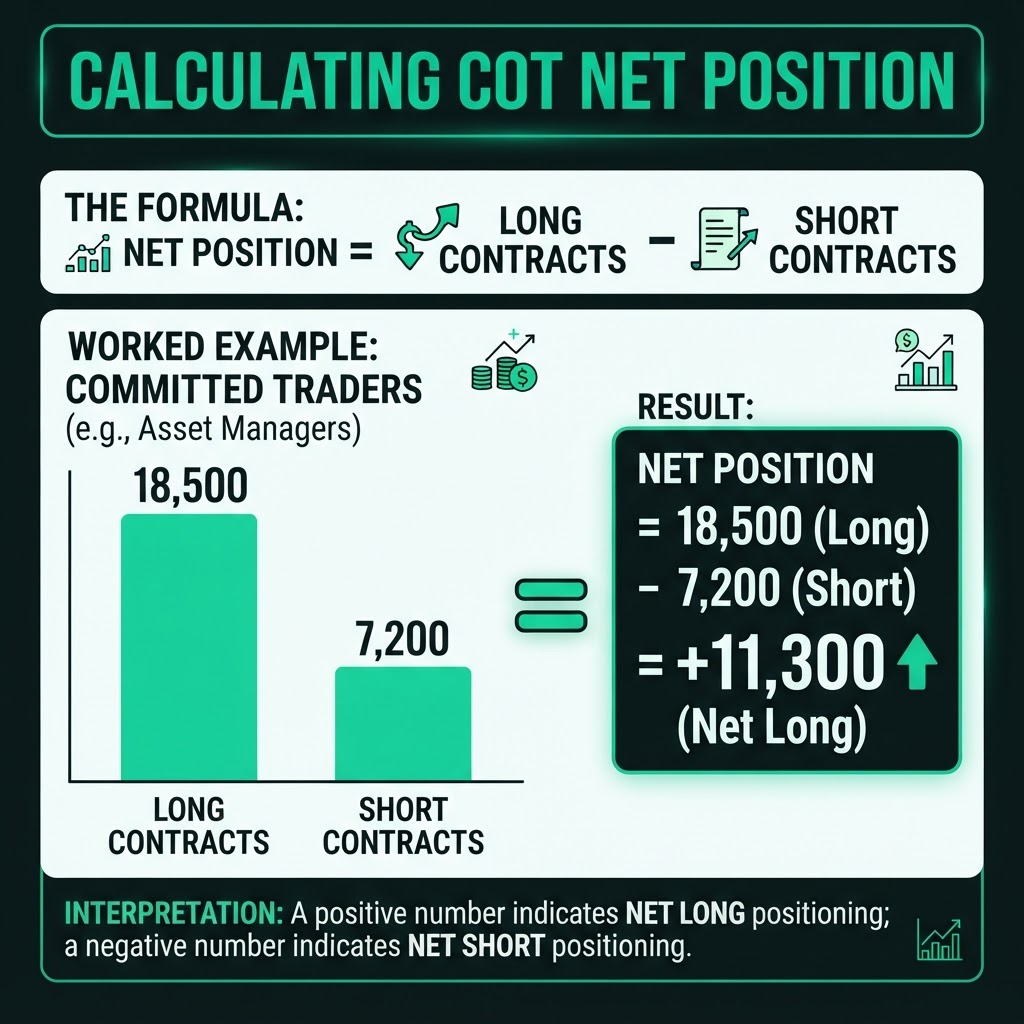
The weekly change is often as informative as the absolute figure. Rapid accumulation can confirm a developing trend, while declining net exposure may reveal weakening conviction before price fully reverses.
Positioning Extremes
A number has meaning only in historical context. Net long exposure of 50,000 contracts may be extreme for one currency and ordinary for another. Compare current positioning with its own one-year or three-year range.
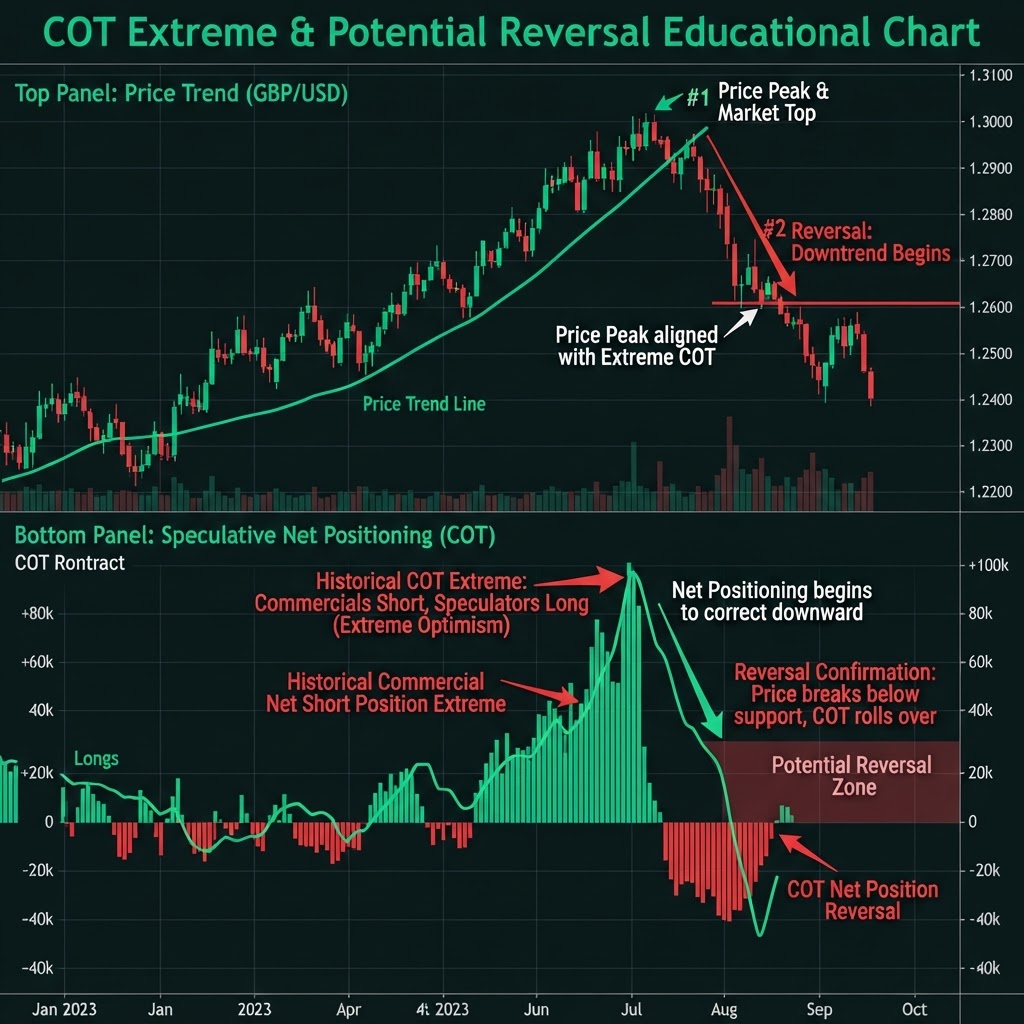
An extreme does not automatically signal an immediate reversal. Strong trends can keep positioning stretched for months. Treat extremes as a condition that raises risk, then require price confirmation such as failed continuation, a structure break, or divergence between price and positioning.
Building a Weekly Process
COT data is slow-moving, so it is best suited to swing or position-trading bias rather than precise intraday entries.
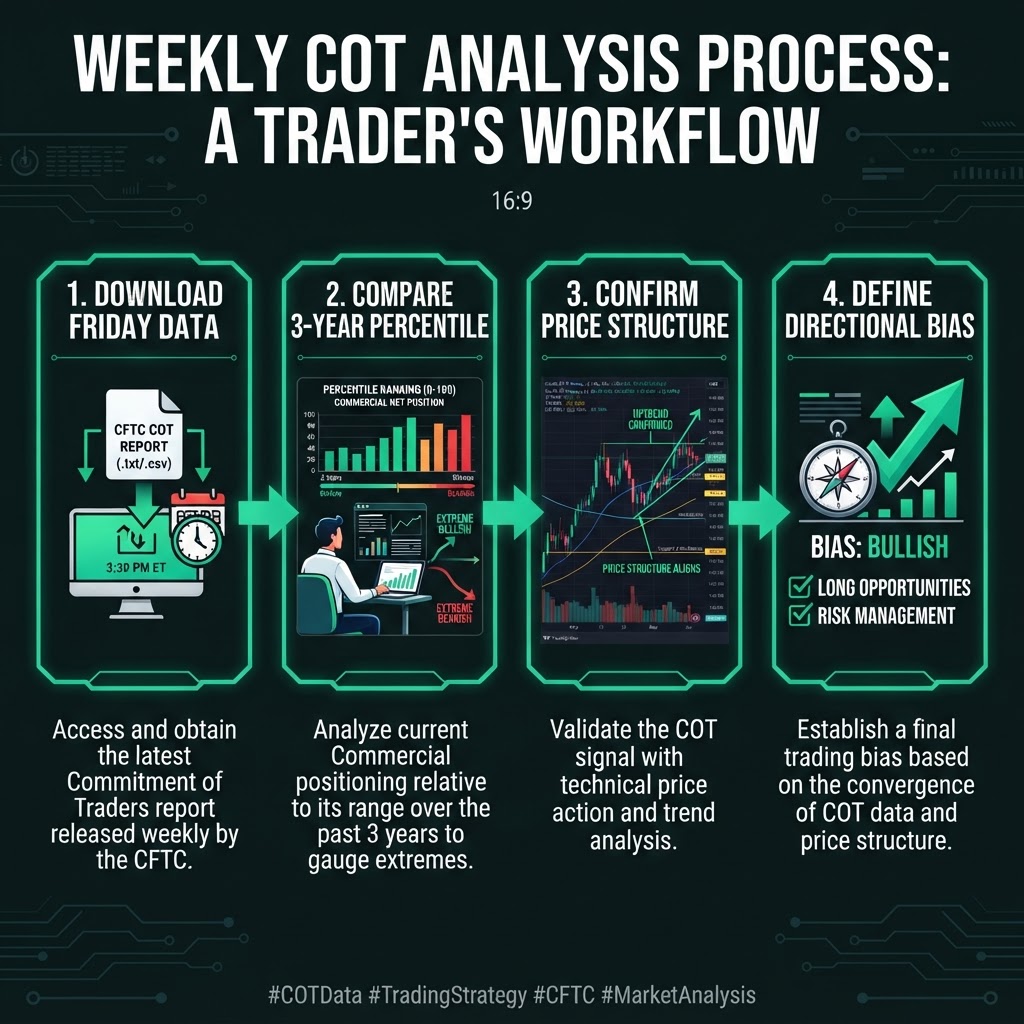
A practical process is:
- 1Record non-commercial longs, shorts, and net position.
- 2Calculate the weekly change and historical percentile.
- 3Compare positioning with the higher-timeframe price trend.
- 4Note whether price and positioning confirm or diverge.
- 5Use technical structure to time an entry.
For example, rising net longs alongside a weekly uptrend supports a bullish bias. If price makes a new high while net longs fall sharply, the divergence warns that the move may be losing sponsorship.
Important Limitations
The report is delayed: Tuesday's positions are normally released on Friday. It reflects futures, not the entire decentralized spot forex market. Hedging activity can also be complex, and a participant category does not reveal every trader's motive.
Do not use COT as a standalone buy or sell signal. Combine it with monetary policy, macroeconomic data, valuation, and price structure.
Final Takeaway
COT data helps traders see how major participant groups are positioned and whether that positioning is building, fading, or historically stretched. Its best use is to frame medium-term bias and risk—not to predict the next candle.