Market Structure: Reading the Language of Price Action
Market Structure: Reading the Language of Price Action
Introduction: The Foundation of All Technical Analysis
Before indicators, before patterns, before trend lines, there is market structure. Market structure is the most fundamental form of technical analysis — it is the raw language of price. It tells you whether the market is going up, going down, or going sideways, and it does so without any lag, any formula, or any interpretation.
Every other form of technical analysis — indicators, patterns, Fibonacci — is built on top of market structure. If you do not understand structure, you are building on sand. In this article, we will explore the three types of market structure, how to identify them, and how to spot when the structure is changing.
The Three Types of Market Structure
Markets can only do one of three things at any given time: trend up, trend down, or range sideways. These are the three market structures.
1. Uptrend Structure: Higher Highs and Higher Lows
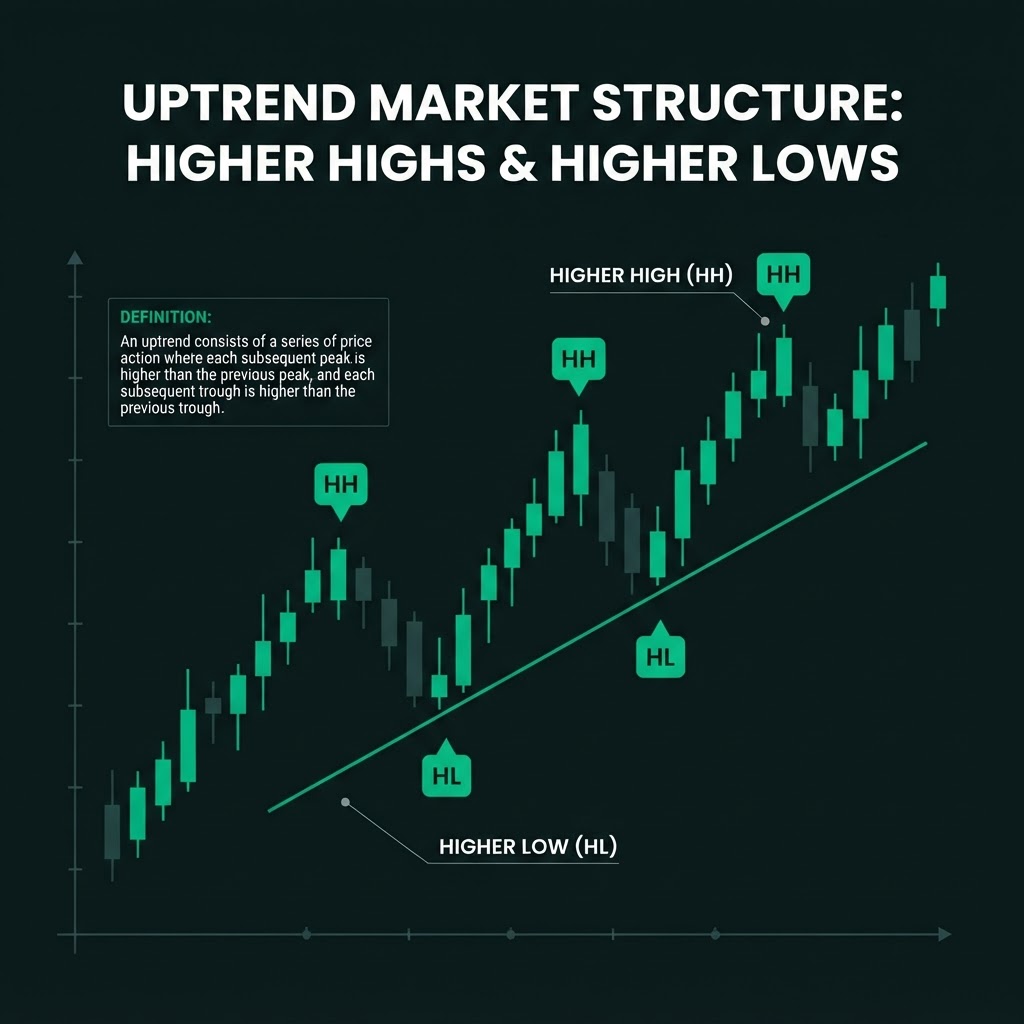
An uptrend is defined by a series of higher highs (HH) and higher lows (HL). Each successive peak is higher than the previous one, and each successive trough is also higher than the previous one. This shows that buyers are in control and are willing to pay higher and higher prices.
Key Points
- Higher High (HH): A peak that is higher than the previous peak.
- Higher Low (HL): A trough that is higher than the previous trough.
- The pattern of HH-HL-HH-HL confirms the uptrend is intact.
- As long as price continues to make higher highs and higher lows, the uptrend is in effect.
Trading an Uptrend
In an uptrend, the strategy is to buy the dips. Wait for price to pull back to a higher low, look for a reversal signal, and enter long. Your stop loss goes below the most recent higher low. Your target is the most recent higher high or beyond.
2. Downtrend Structure: Lower Highs and Lower Lows
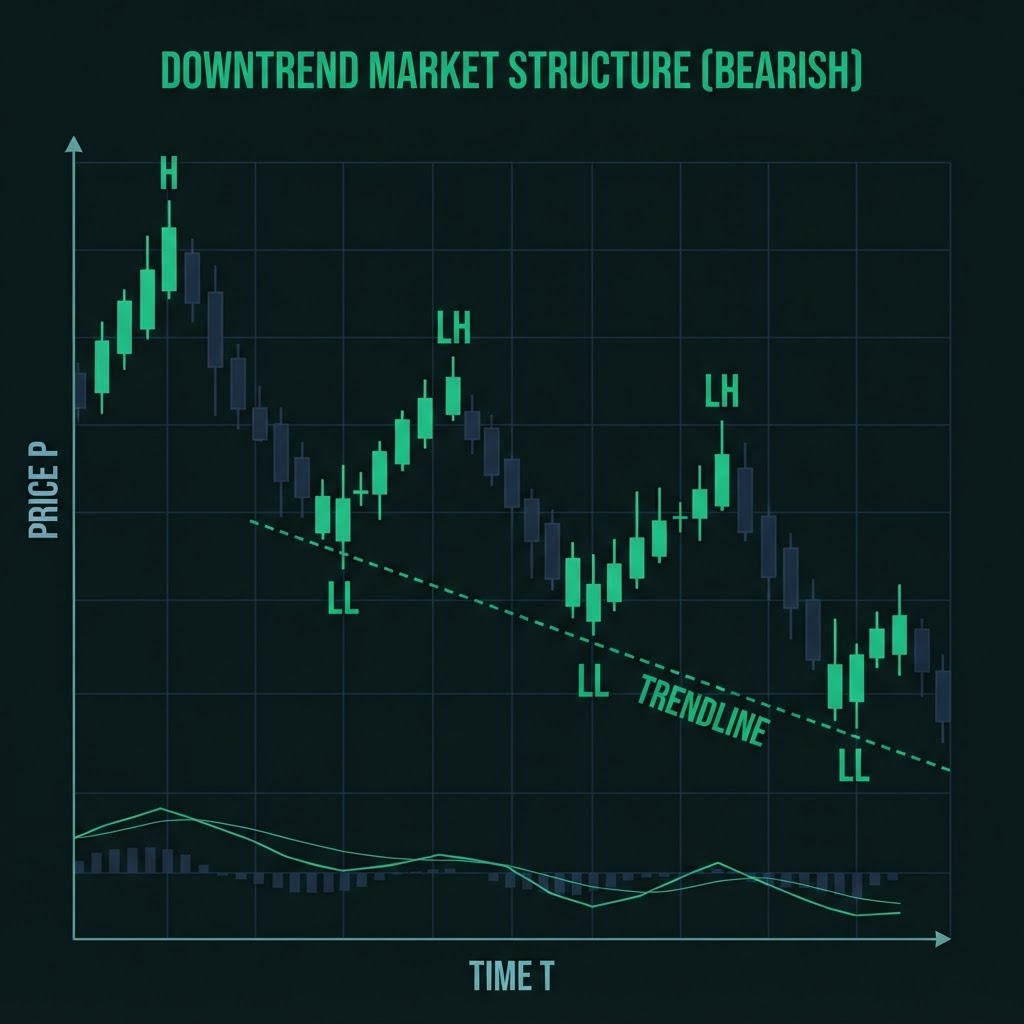
A downtrend is the mirror image — a series of lower highs (LH) and lower lows (LL). Each successive peak is lower than the previous one, and each successive trough is also lower than the previous one. This shows that sellers are in control.
Key Points
- Lower High (LH): A peak that is lower than the previous peak.
- Lower Low (LL): A trough that is lower than the previous trough.
- The pattern of LH-LL-LH-LL confirms the downtrend is intact.
- As long as price continues to make lower highs and lower lows, the downtrend is in effect.
Trading a Downtrend
In a downtrend, the strategy is to sell the rallies. Wait for price to bounce up to a lower high, look for a reversal signal, and enter short. Your stop loss goes above the most recent lower high. Your target is the most recent lower low or beyond.
3. Range Structure: Sideways Movement
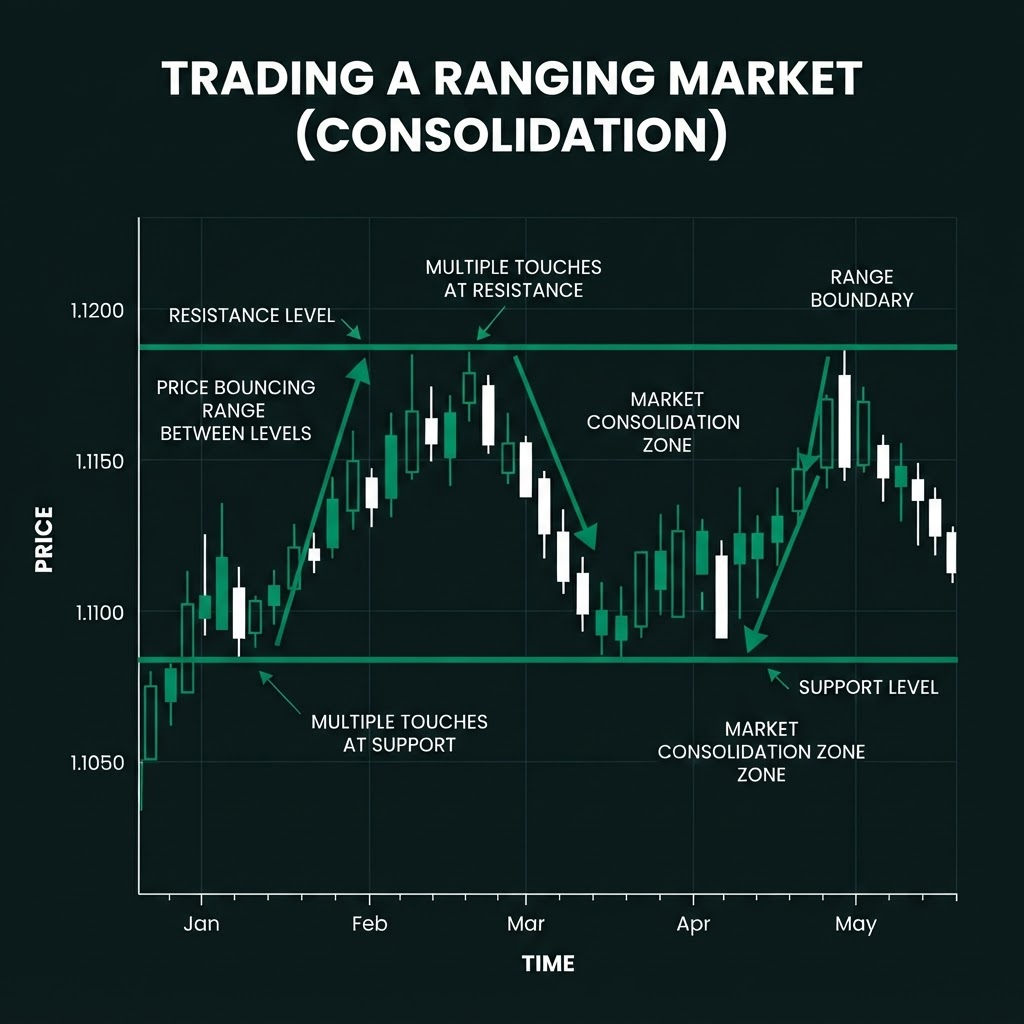
A range (or sideways market) occurs when price moves between a horizontal support level and a horizontal resistance level without making clear higher highs/higher lows or lower highs/lower lows. In a range, highs are approximately equal and lows are approximately equal.
Key Points
- Equal Highs: The peaks are roughly at the same level (resistance).
- Equal Lows: The troughs are roughly at the same level (support).
- Price bounces between support and resistance without breaking out.
- Ranges can last for extended periods and are common in low-volatility environments.
Trading a Range
In a range, the strategy is to buy at support and sell at resistance. Wait for price to reach the boundary, look for a reversal signal, and enter in the opposite direction. Stop loss goes just beyond the range boundary. Target is the opposite boundary.
Warning: Ranges eventually break. When price breaks above resistance or below support with conviction, the range is over and a new trend may be beginning. Do not fight the breakout.
Structure Breaks: When the Trend Changes
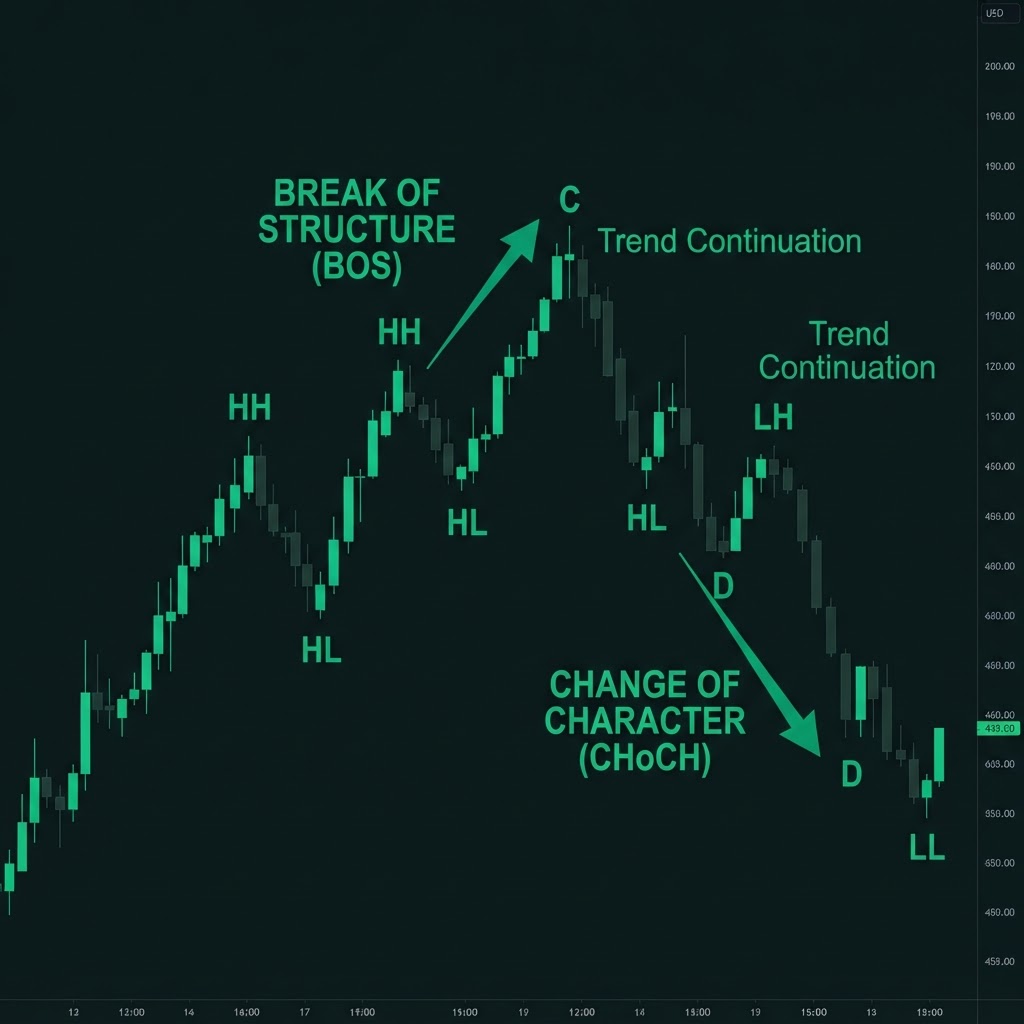
The most important skill in market structure analysis is recognizing when the structure breaks. A structure break is the first sign that the trend may be reversing. There are two key concepts: Break of Structure (BOS) and Change of Character (CHoCH).
Break of Structure (BOS) — Trend Continuation
A Break of Structure occurs when price breaks above the most recent higher high in an uptrend (or below the most recent lower low in a downtrend). This confirms that the trend is continuing.
- Bullish BOS: Price breaks above the previous higher high. The uptrend is confirmed and likely to continue.
- Bearish BOS: Price breaks below the previous lower low. The downtrend is confirmed and likely to continue.
A BOS is a signal to look for entries in the direction of the trend. After a BOS, price typically pulls back to form a new higher low (in an uptrend) or lower high (in a downtrend), which provides an entry opportunity.
Change of Character (CHoCH) — Trend Reversal
A Change of Character occurs when the structure pattern reverses. In an uptrend, if price fails to make a higher high and instead breaks below the most recent higher low, the structure has shifted from higher highs/higher lows to potentially lower highs/lower lows. This is the first warning of a trend reversal.
- Bearish CHoCH: In an uptrend, price breaks below the most recent higher low. The uptrend may be ending.
- Bullish CHoCH: In a downtrend, price breaks above the most recent lower high. The downtrend may be ending.
A CHoCH is not a guaranteed reversal — it is a warning. Price may resume the original trend after a brief pullback. But when a CHoCH is followed by a BOS in the opposite direction, the reversal is confirmed.
The Sequence: CHoCH → BOS
A typical trend reversal follows this sequence:
- 1Uptrend is intact: HH, HL, HH, HL...
- 2CHoCH: Price fails to make a new HH and breaks below the last HL. Warning.
- 3Pullback: Price rallies to form a LH (lower high).
- 4Bearish BOS: Price breaks below the most recent LL. Reversal confirmed.
- 5New downtrend begins: LH, LL, LH, LL...
Learning to spot this sequence is one of the most valuable skills in trading. It allows you to identify trend reversals early, often before indicators or patterns confirm them.
Multi-Timeframe Structure Analysis
Market structure exists on every timeframe, and structures on different timeframes interact. A trend may be up on the daily chart but down on the 15-minute chart. Understanding this relationship is crucial.
The Rule of Higher Timeframe Dominance
The higher timeframe structure always takes precedence. If the daily chart is in a clear uptrend (HH/HL), then even if the 15-minute chart shows a downtrend (LH/LL), the overall bias should be bullish. The 15-minute downtrend is likely a pullback within the daily uptrend.
Practical Approach
- 1Start with the higher timeframe (Daily or 4H): Determine the overall structure (uptrend, downtrend, or range).
- 2Drop to the lower timeframe (1H or 15m): Look for structure breaks and entry opportunities in the direction of the higher timeframe trend.
- 3Enter on the lower timeframe: Use the lower timeframe to find precise entries that align with the higher timeframe structure.
This approach gives you the best of both worlds: the reliability of the higher timeframe and the precision of the lower timeframe.
Common Mistakes
- 1Ignoring the structure: Many traders focus on indicators and patterns without first understanding the market structure. Always determine the structure first.
- 1Trading against the structure: Trying to short in an uptrend or go long in a downtrend because an indicator says so. The structure is the ultimate truth.
- 1Calling a reversal too early: A single CHoCH does not guarantee a reversal. Wait for confirmation (a BOS in the opposite direction) before committing to a reversal trade.
- 1Not using multiple timeframes: Looking at only one timeframe gives you a limited view. Always check at least two timeframes.
- 1Forcing structure on chop: Not every market has clear structure. Sometimes the market is choppy and structure is unclear. In these cases, the best trade is no trade.
Conclusion
Market structure is the foundation of all technical analysis. It is the raw, unfiltered truth of what the market is doing. Indicators lag, patterns can be subjective, but structure is objective: price is either making higher highs and higher lows, lower highs and lower lows, or it is ranging. Master the ability to read market structure, and you will have a skill that works on every market, every timeframe, and every trading style. Learn to identify the structure, trade with it, and spot when it changes. This is the language of the market — and once you speak it, you will never see a chart the same way again.