Trend Lines and Channels: Drawing and Trading the Trend
Trend Lines and Channels: Drawing and Trading the Trend
Introduction: The Trend Is Your Friend
"The trend is your friend" is one of the oldest adages in trading, and for good reason. Trading in the direction of the trend dramatically increases your probability of success. But to trade the trend, you first need to be able to identify it, draw it, and know when it has changed. That is where trend lines and channels come in.
Trend lines are one of the simplest yet most powerful tools in technical analysis. A single diagonal line can tell you whether the market is in an uptrend, a downtrend, or a range. Channels take this one step further by defining both the floor and the ceiling of the trend, giving you precise entry and exit points.
What Is a Trend Line?
A trend line is a straight diagonal line drawn connecting at least two significant swing points on a price chart. It acts as a dynamic support or resistance level — price tends to bounce off it when it touches.
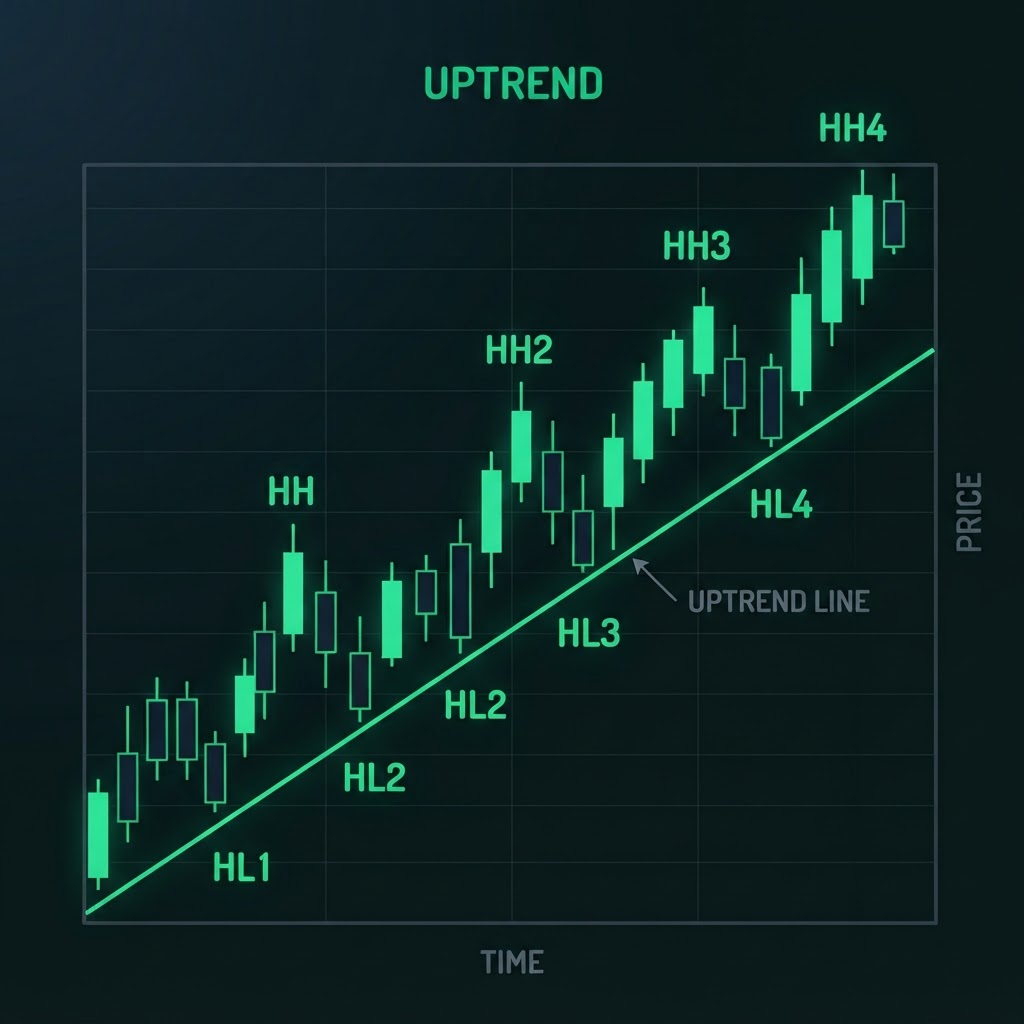
Uptrend Line (Support)
In an uptrend, price makes higher highs and higher lows. An uptrend line is drawn by connecting at least two higher lows. This line acts as dynamic support — price tends to bounce up when it touches the line.
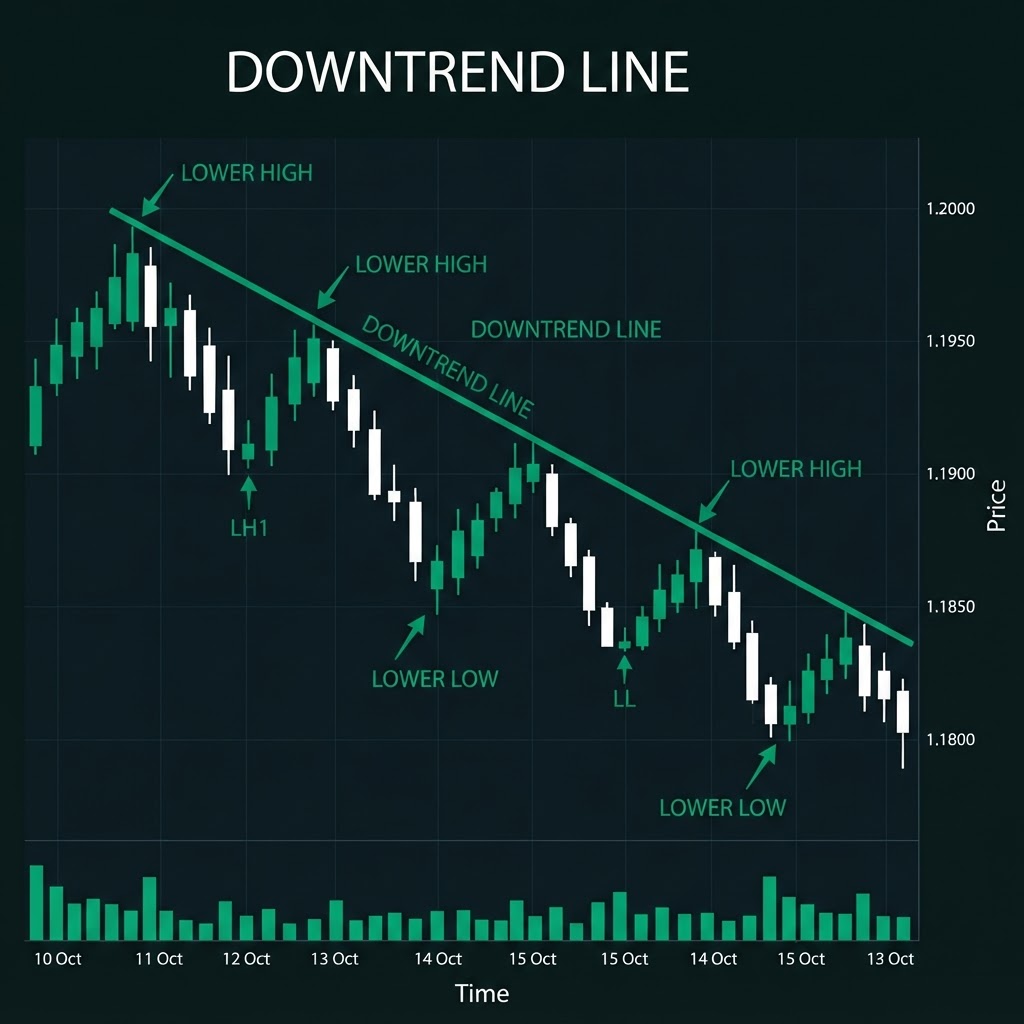
Downtrend Line (Resistance)
In a downtrend, price makes lower highs and lower lows. A downtrend line is drawn by connecting at least two lower highs. This line acts as dynamic resistance — price tends to bounce down when it touches the line.
How to Draw a Trend Line Correctly
Drawing trend lines is more art than science, but there are rules that improve accuracy:
- 1Connect significant points: Do not force a line through random candles. Connect major swing highs or swing lows that are clearly visible.
- 1At least two touches: A trend line needs at least two touch points to be valid. Three or more touches make it stronger.
- 1Do not redraw: Once you draw a trend line, do not move it to fit price. If price breaks the line, the trend may be changing — accept it.
- 1Angle matters: A trend line that is too steep (nearly vertical) is unsustainable and likely to break quickly. A trend line that is too flat may not represent a real trend. A 30-45 degree angle is typical for sustainable trends.
- 1Use higher timeframes: Trend lines on daily and 4-hour charts are more reliable than those on 5-minute charts. Start with the higher timeframe and then zoom in.
Trading Channels
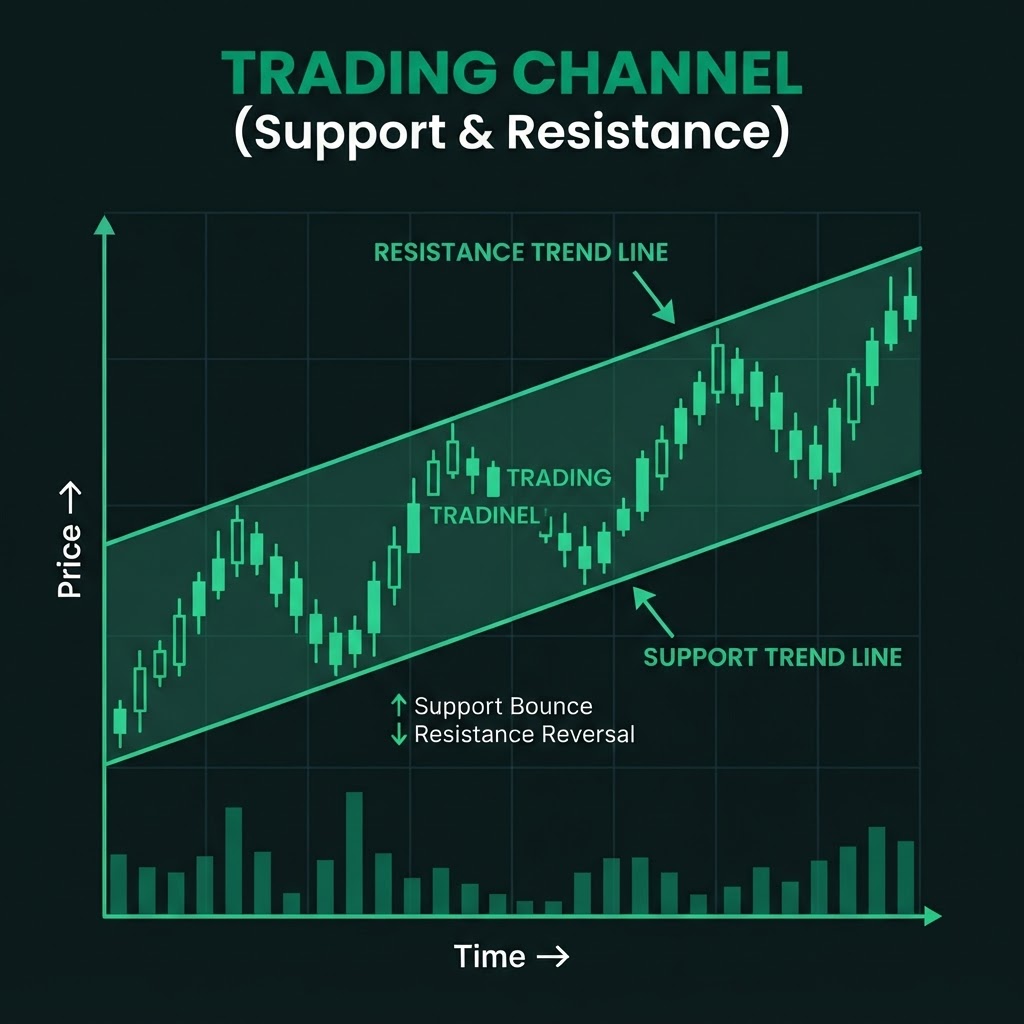
A channel is created when you draw a parallel line on the opposite side of the trend, connecting the highs in an uptrend or the lows in a downtrend. The channel defines the boundaries within which price is moving.
How to Draw a Channel
- 1Draw your main trend line (connecting lows in an uptrend, highs in a downtrend).
- 2Draw a parallel line through the most recent swing high (in an uptrend) or swing low (in a downtrend).
- 3The two parallel lines form the channel.
Trading the Channel
- Buy at the lower channel line (support) in an uptrend.
- Sell at the upper channel line (resistance) in an uptrend.
- Sell at the upper channel line (resistance) in a downtrend.
- Buy at the lower channel line (support) in a downtrend.
Channel trading works best in well-defined, orderly trends. In strong trending markets, price may not reach the opposite channel line, so be flexible and look for confirmation at each touch.
Trend Line Breakouts: When the Trend Changes
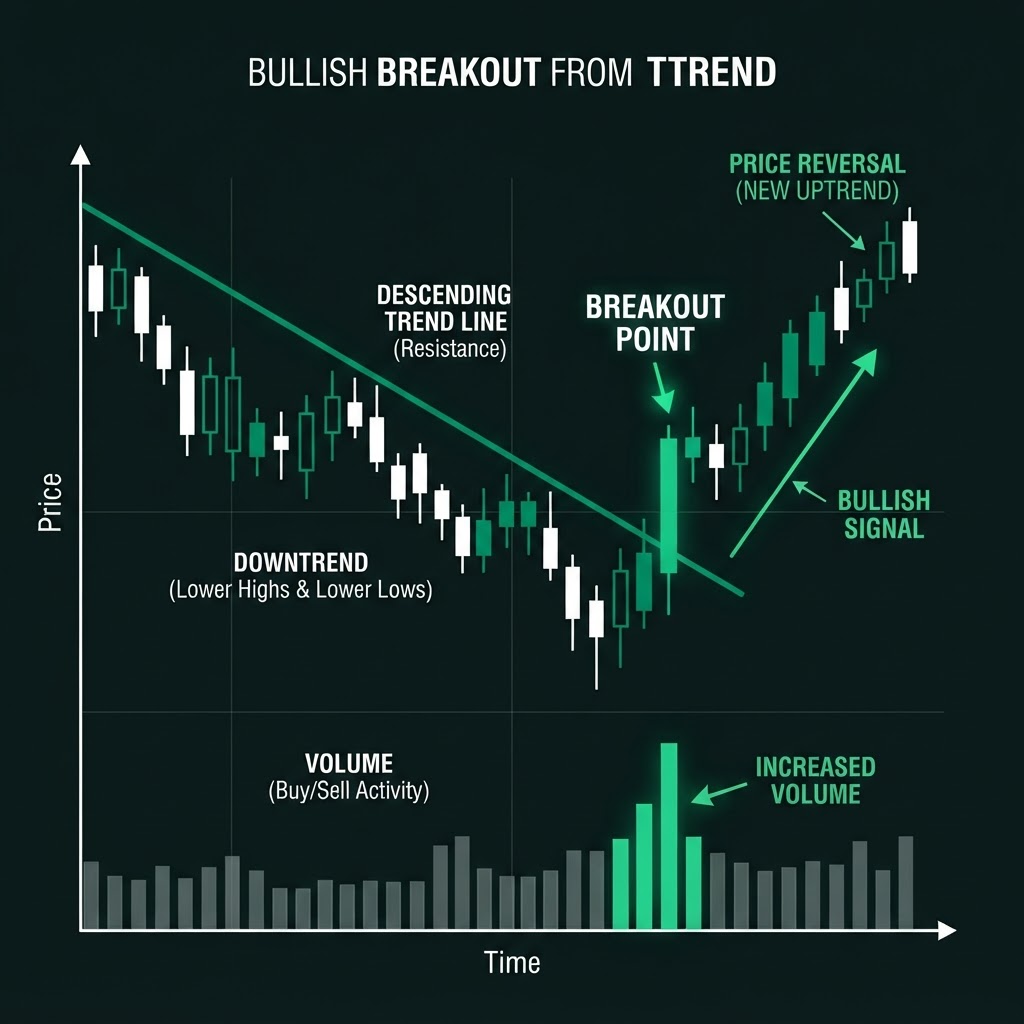
A trend line breakout occurs when price moves through the trend line with conviction. This is one of the most important signals in technical analysis because it often signals a trend reversal or a significant pullback.
Types of Breakouts
- 1True Breakout: Price breaks the trend line, retests it from the other side (the line that was support becomes resistance, or vice versa), and then continues in the new direction. This is the most reliable type.
- 1False Breakout (Fakeout): Price briefly breaks the trend line but then quickly reverses back. This traps breakout traders and often leads to a strong move in the original trend direction.
How to Trade Breakouts
- Wait for the close: Do not enter the moment price touches the trend line. Wait for a candle to close beyond the line to confirm the breakout.
- Look for retest: After the breakout, price often comes back to retest the broken trend line. This retest is a safer entry point than entering on the breakout itself.
- Enter on retest: Place your entry when price touches the broken trend line from the other side and shows a reversal candle.
- Stop loss: Place your stop loss beyond the most recent swing high or low.
Identifying False Breakouts
False breakouts are the enemy of breakout traders. Signs that a breakout may be false:
- The breakout candle is small and lacks momentum.
- Volume is low.
- Price immediately reverses back inside the channel/trend line within the next 1-2 candles.
- The breakout happens during low-liquidity hours (e.g., late US session).
Practical Trading Strategies
Strategy 1: Trend Line Bounce (With the Trend)
- 1Identify a clear trend with a well-respected trend line.
- 2Wait for price to pull back to the trend line.
- 3Look for a reversal candlestick pattern (pin bar, engulfing) at the trend line.
- 4Enter in the direction of the trend.
- 5Place your stop loss just beyond the trend line.
- 6Take profit at the opposite channel line or the most recent swing high/low.
Strategy 2: Channel Trading
- 1Draw a channel around a clear trending market.
- 2Buy at the lower channel line, sell at the upper channel line.
- 3Use reversal candlestick patterns as entry triggers.
- 4Stop loss goes beyond the channel line.
- 5Exit partially at the opposite channel line and hold the rest for a potential channel breakout.
Strategy 3: Breakout and Retest
- 1Wait for price to break the trend line with a strong candle.
- 2Wait for price to retest the broken trend line from the other side.
- 3Look for a reversal candle at the retest.
- 4Enter in the direction of the breakout.
- 5Stop loss goes beyond the retest point.
Common Mistakes
- 1Drawing forced lines: Do not draw a trend line through candles. The line should touch the tips of the wicks, not cut through candle bodies.
- 2Redrawing lines: If your trend line is broken, do not redraw it to make it fit. Accept the break.
- 3Trading every touch: Not every touch of a trend line is a trade. Wait for confirmation.
- 4Ignoring the bigger picture: A trend line on a 15-minute chart is less significant than one on a daily chart. Always know what the higher timeframes are doing.
Conclusion
Trend lines and channels are fundamental tools that every trader should master. They are simple to draw but require practice to use effectively. The key is to draw them correctly, wait for price to come to them, and then trade with confirmation. Remember that trend lines are not permanent — they break. When they do, the market is telling you something has changed. Listen to it, adjust your strategy, and always protect your capital with a stop loss.