Chart Patterns: Head and Shoulders, Triangles, Flags, and Double Tops
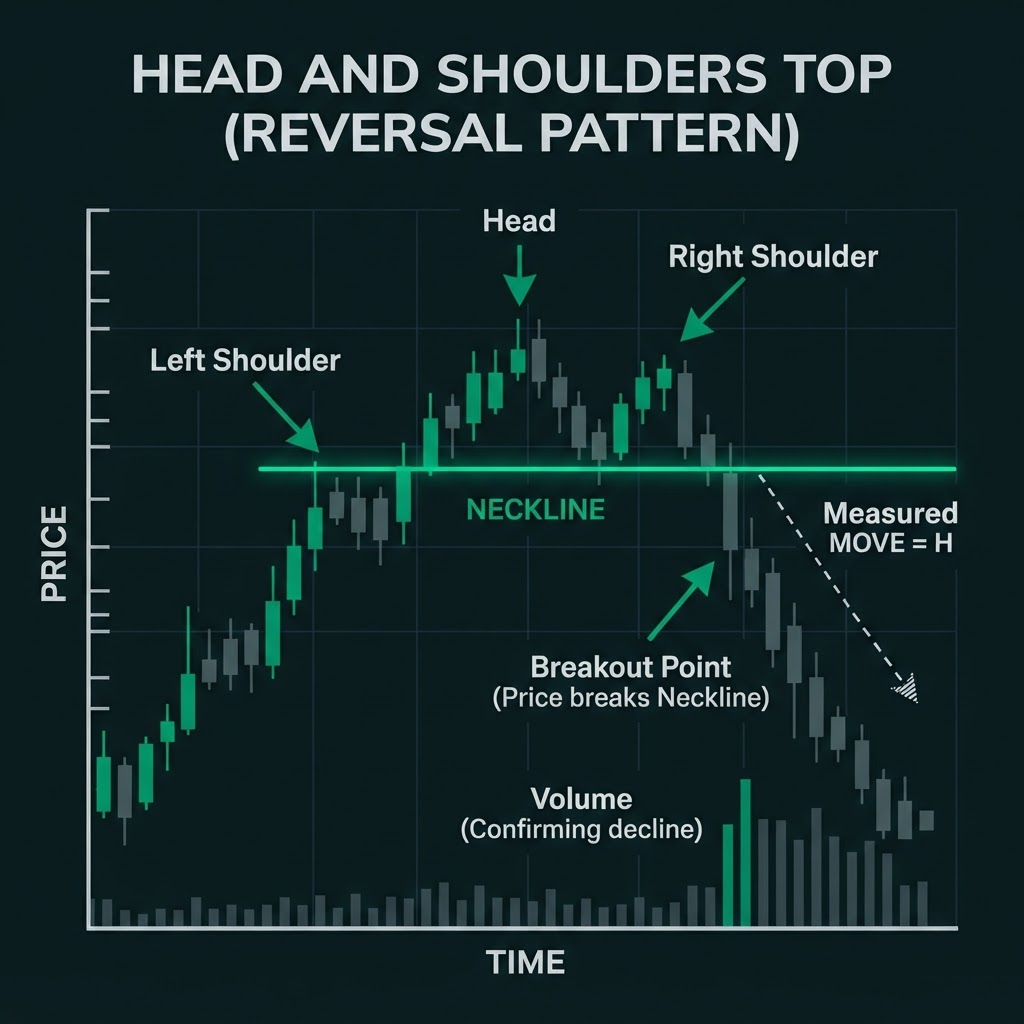
Chart Patterns: Head and Shoulders, Triangles, Flags, and Double Tops
Introduction: The Language of Price
Chart patterns are visual formations that appear on price charts and provide clues about what the market is likely to do next. They are the footprints of market psychology — the collective behavior of thousands of traders and investors expressed as recognizable shapes.
While no pattern is 100% reliable, certain patterns have stood the test of time and appear repeatedly across all markets and timeframes. In this article, we will cover four of the most important categories: the head and shoulders, triangle patterns, flags and pennants, and double tops and bottoms.
1. Head and Shoulders: The Classic Reversal Pattern
The head and shoulders is one of the most famous and reliable reversal patterns in technical analysis. It typically forms at the end of an uptrend and signals that the trend is about to reverse downward.
Pattern Structure
- 1Left Shoulder: Price rises to a peak and then pulls back.
- 2Head: Price rises to a new, higher peak and pulls back again.
- 3Right Shoulder: Price rises to a peak that is lower than the head but approximately equal to the left shoulder, then pulls back.
- 4Neckline: A support line drawn connecting the lows after the left shoulder and the head.
The Psychology
The pattern tells a story of weakening bullish momentum. The left shoulder shows normal buying. The head shows buyers pushing to a new high, but the subsequent pullback suggests sellers are getting stronger. The right shoulder fails to make a new high, confirming that buyers are exhausted. When price breaks below the neckline, the reversal is confirmed.
How to Trade It
- Entry: Sell (short) when price breaks below the neckline with a convincing candle.
- Stop Loss: Place above the right shoulder.
- Take Profit: Measure the distance from the head to the neckline and project that same distance downward from the neckline break.
Inverse Head and Shoulders
The inverse (bottom) head and shoulders is the mirror image — it forms at the end of a downtrend and signals a reversal upward. The same principles apply in reverse.
2. Triangle Patterns: Breakout Trading
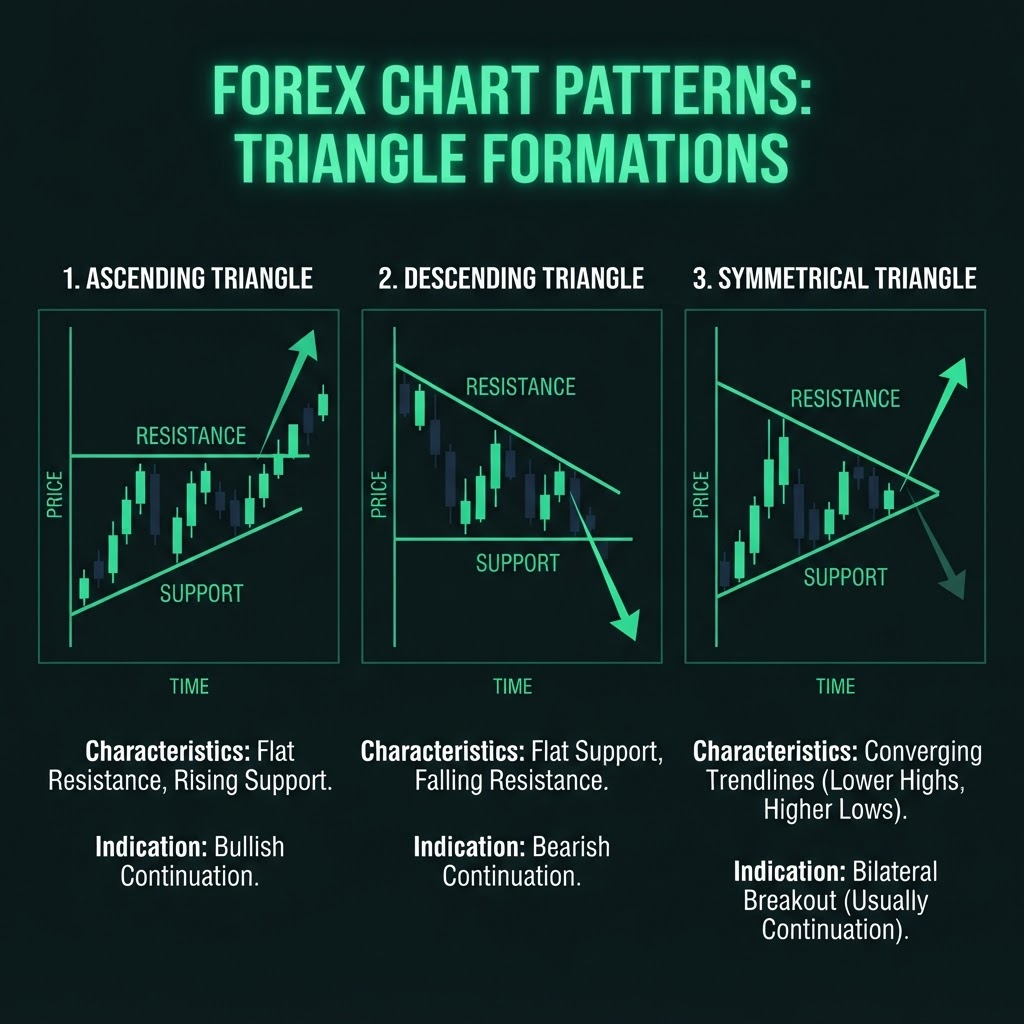
Triangles are continuation patterns that represent a pause in the trend during which price consolidates in a narrowing range. There are three main types:
Ascending Triangle (Bullish)
- Structure: A horizontal resistance line on top and a rising support line on the bottom. The highs are flat, but the lows are getting higher.
- Meaning: Buyers are getting more aggressive with each pullback, pushing higher each time. A breakout above the resistance is expected.
- Entry: Buy when price breaks above the horizontal resistance.
- Stop Loss: Below the most recent swing low within the triangle.
Descending Triangle (Bearish)
- Structure: A horizontal support line on the bottom and a descending resistance line on top. The lows are flat, but the highs are getting lower.
- Meaning: Sellers are getting more aggressive. A breakdown below support is expected.
- Entry: Sell when price breaks below the horizontal support.
- Stop Loss: Above the most recent swing high within the triangle.
Symmetrical Triangle (Neutral)
- Structure: Both the resistance line and the support line are converging, creating a symmetrical shape. Both highs are getting lower and lows are getting higher.
- Meaning: Neither buyers nor sellers are in control. The breakout direction determines the next move. Trade in the direction of the breakout.
- Entry: Enter in the direction of the breakout candle.
- Stop Loss: On the opposite side of the triangle.
Measuring the Target
For all triangles, measure the widest part of the triangle (the base) and project that distance from the breakout point. This gives you an estimated price target.
3. Flags and Pennants: Continuation Patterns
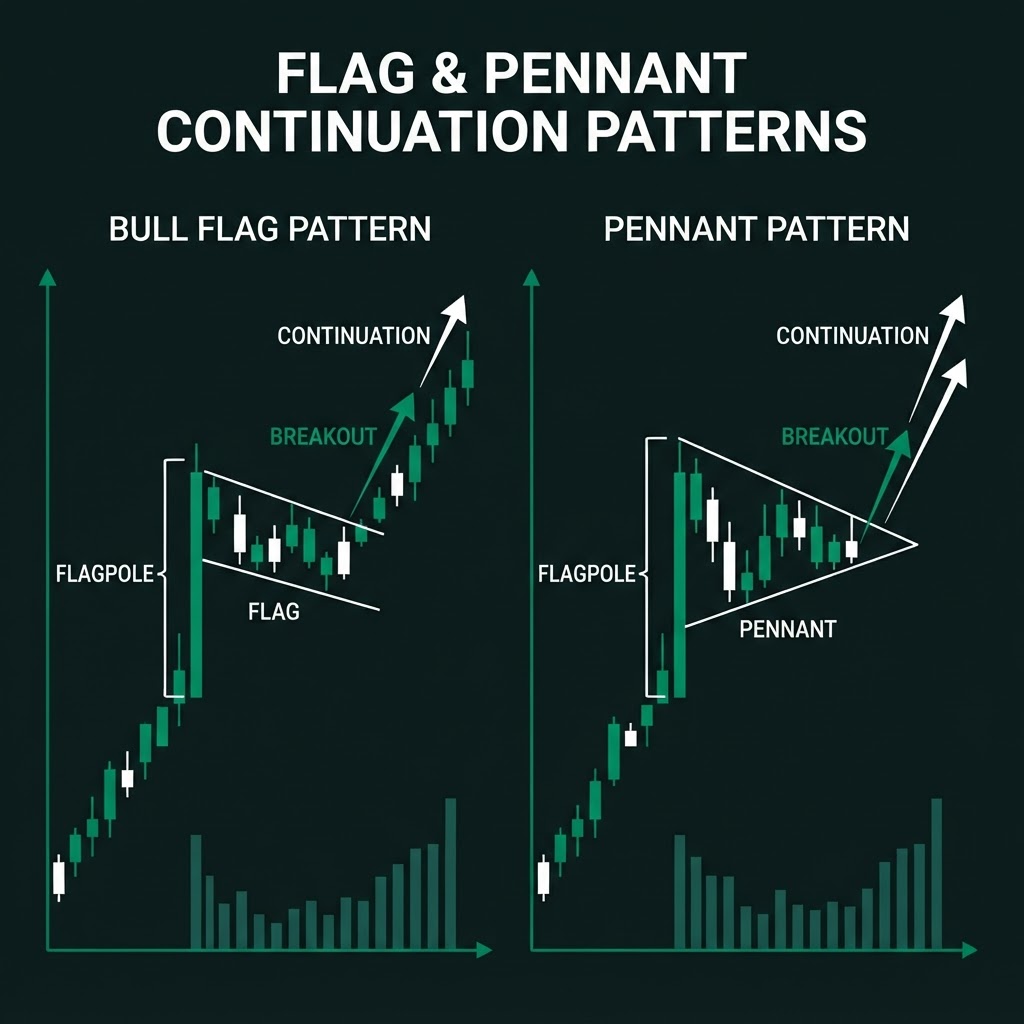
Flags and pennants are short-term continuation patterns that appear after a strong directional move. They represent a brief pause before the trend resumes.
Bull Flag
- Structure: After a strong upward move (the flagpole), price consolidates in a slight downward-sloping channel (the flag).
- Meaning: The pullback is shallow and orderly, suggesting that sellers are weak. The uptrend is likely to continue.
- Entry: Buy when price breaks above the upper boundary of the flag.
- Stop Loss: Below the lowest point of the flag.
- Take Profit: Measure the flagpole height and project it from the breakout point.
Bear Flag
The mirror image of a bull flag. After a strong downward move, price consolidates in a slight upward-sloping channel. Sell when price breaks below the lower boundary.
Pennant
A pennant is similar to a flag but the consolidation takes the form of a small symmetrical triangle rather than a channel. The trading approach is the same — enter in the direction of the breakout.
4. Double Tops and Double Bottoms
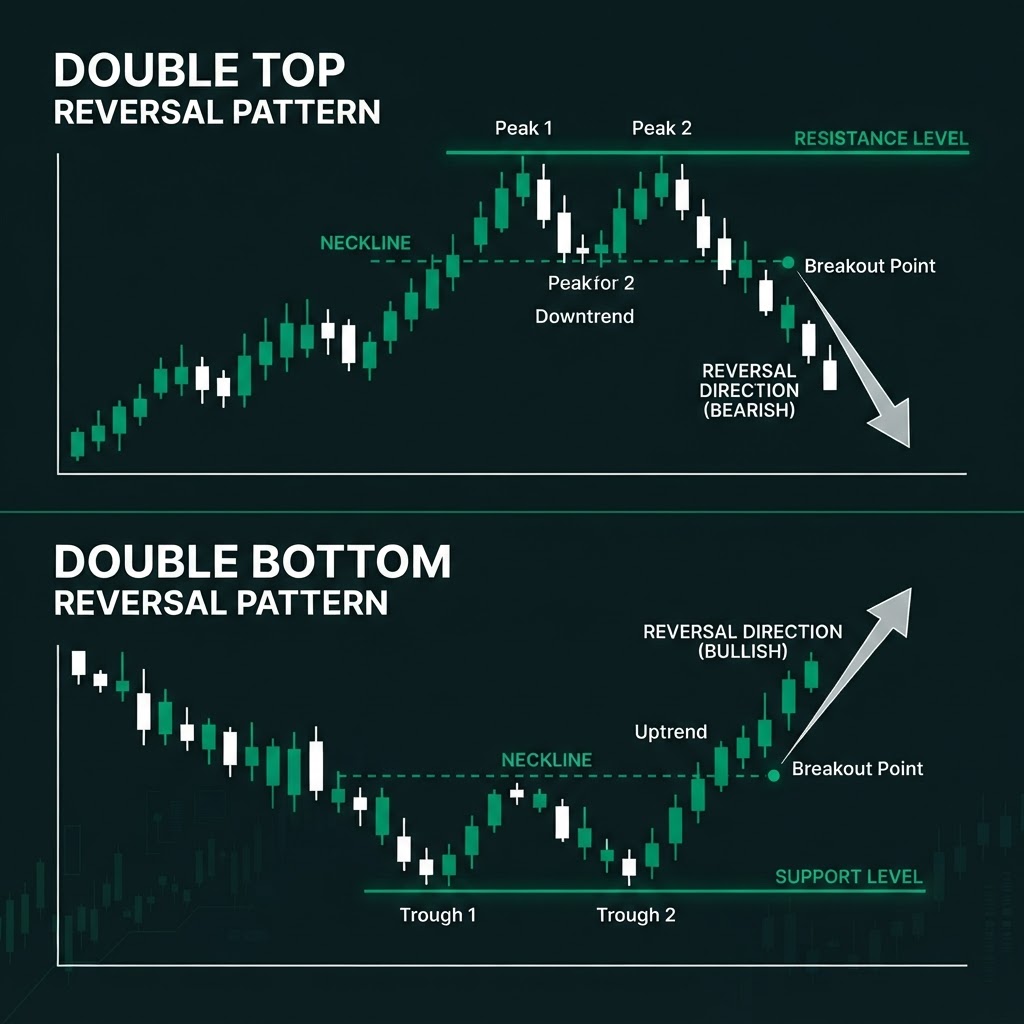
Double tops and bottoms are reversal patterns that signal the end of a trend. They are among the most reliable chart patterns when traded correctly.
Double Top (Bearish Reversal)
- Structure: Price rises to a high, pulls back, then rises to approximately the same high again and pulls back. The two highs form a resistance level.
- Meaning: Buyers failed twice to push above the same level, indicating that the uptrend has exhausted.
- Entry: Sell when price breaks below the pullback low (the valley between the two peaks).
- Stop Loss: Above the two peaks.
- Take Profit: Measure the height from the peaks to the valley and project it downward from the breakout.
Double Bottom (Bullish Reversal)
- Structure: Price falls to a low, bounces, then falls to the same low again and bounces. The two lows form a support level.
- Meaning: Sellers failed twice to push below the same level, indicating that the downtrend has exhausted.
- Entry: Buy when price breaks above the bounce high (the peak between the two lows).
- Stop Loss: Below the two lows.
- Take Profit: Measure the height from the lows to the peak and project it upward.
General Rules for Trading Chart Patterns
- 1Wait for confirmation: Never enter before the pattern is complete. For reversal patterns, wait for the neckline or support/resistance break. For triangles and flags, wait for the breakout.
- 1Consider the context: A double top at a major weekly resistance level is far more significant than one in the middle of a range. Always check the bigger picture.
- 1Volume matters: On breakout, look for increased volume as confirmation. Low-volume breakouts are more likely to be false.
- 1Patterns fail: No pattern is 100% reliable. Always use a stop loss and accept that some patterns will fail. The key is to ensure your winners are larger than your losers.
- 1Multiple timeframes: A pattern on a daily chart is more reliable than one on a 15-minute chart. Use higher timeframes for pattern identification and lower timeframes for entry refinement.
Conclusion
Chart patterns are not magic signals — they are visual representations of the ongoing battle between buyers and sellers. The head and shoulders tells you when a trend is dying. Triangles tell you when the market is coiling for a breakout. Flags tell you when a trend is pausing before continuing. Double tops and bottoms tell you when a level is being defended. Learn to recognize these patterns, trade them with discipline, and always protect your capital with a stop loss. Over time, pattern recognition becomes second nature, and these formations become valuable tools in your trading arsenal.