Supply and Demand Zones: How to Identify and Trade Key Price Levels
Supply and Demand Zones: How to Identify and Trade Key Price Levels
Introduction: Beyond Support and Resistance
Support and resistance lines are the most widely taught concepts in technical analysis. But behind every strong support or resistance level, there is a deeper force at work: supply and demand. Supply and demand zones go beyond single price lines — they represent areas on the chart where institutional buying or selling created a massive imbalance, resulting in a strong directional move.
Understanding supply and demand zones allows you to see the market through the eyes of institutions. Instead of reacting to price action, you anticipate it by identifying the zones where large players are likely to re-enter the market.
What Is a Supply Zone?
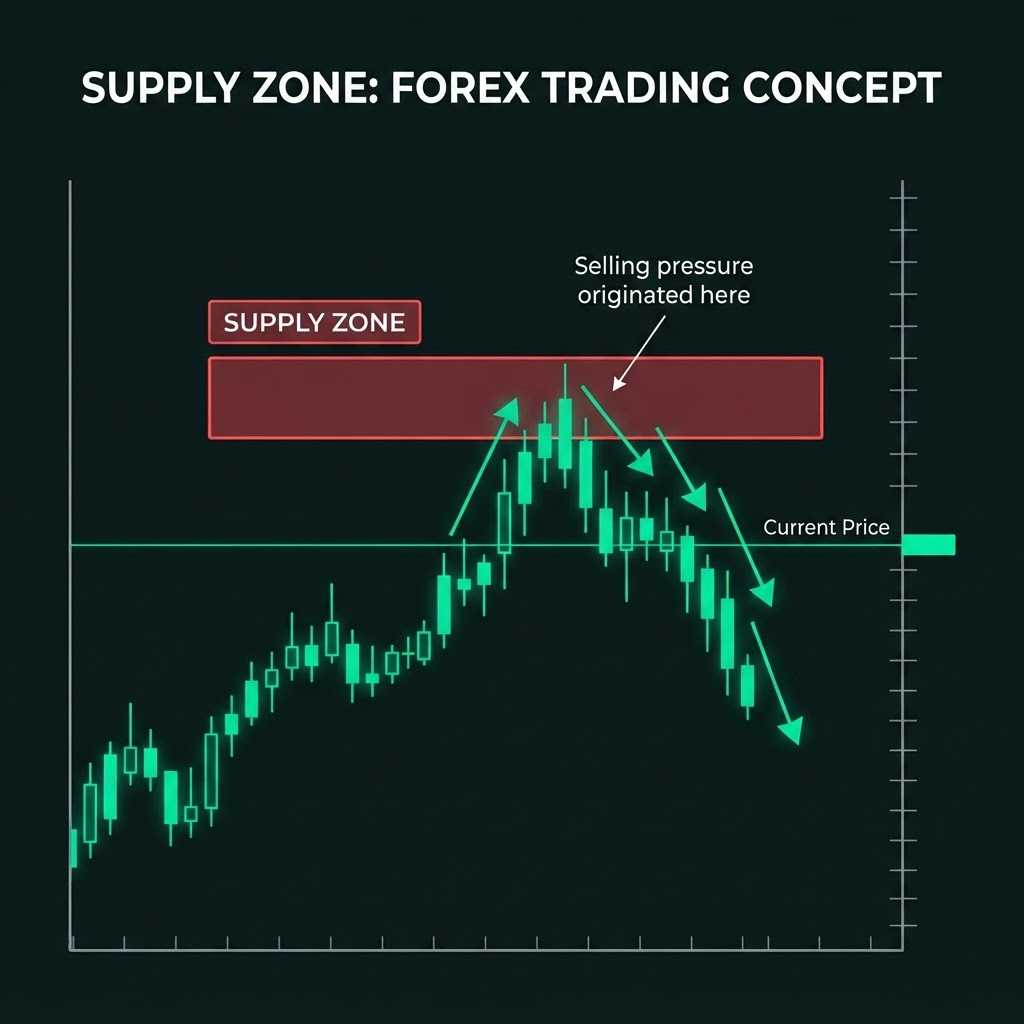
A supply zone is a price area where selling pressure overwhelmed buying pressure, causing price to drop sharply. It represents a concentration of sell orders — both from institutions looking to sell and from stop-loss orders of buyers who entered in that zone.
When price returns to a supply zone, sellers are likely to re-enter the market, pushing price down again. This makes supply zones ideal areas to look for short (sell) opportunities.
What Is a Demand Zone?
A demand zone is the opposite — a price area where buying pressure overwhelmed selling pressure, causing price to rise sharply. It represents a concentration of buy orders.
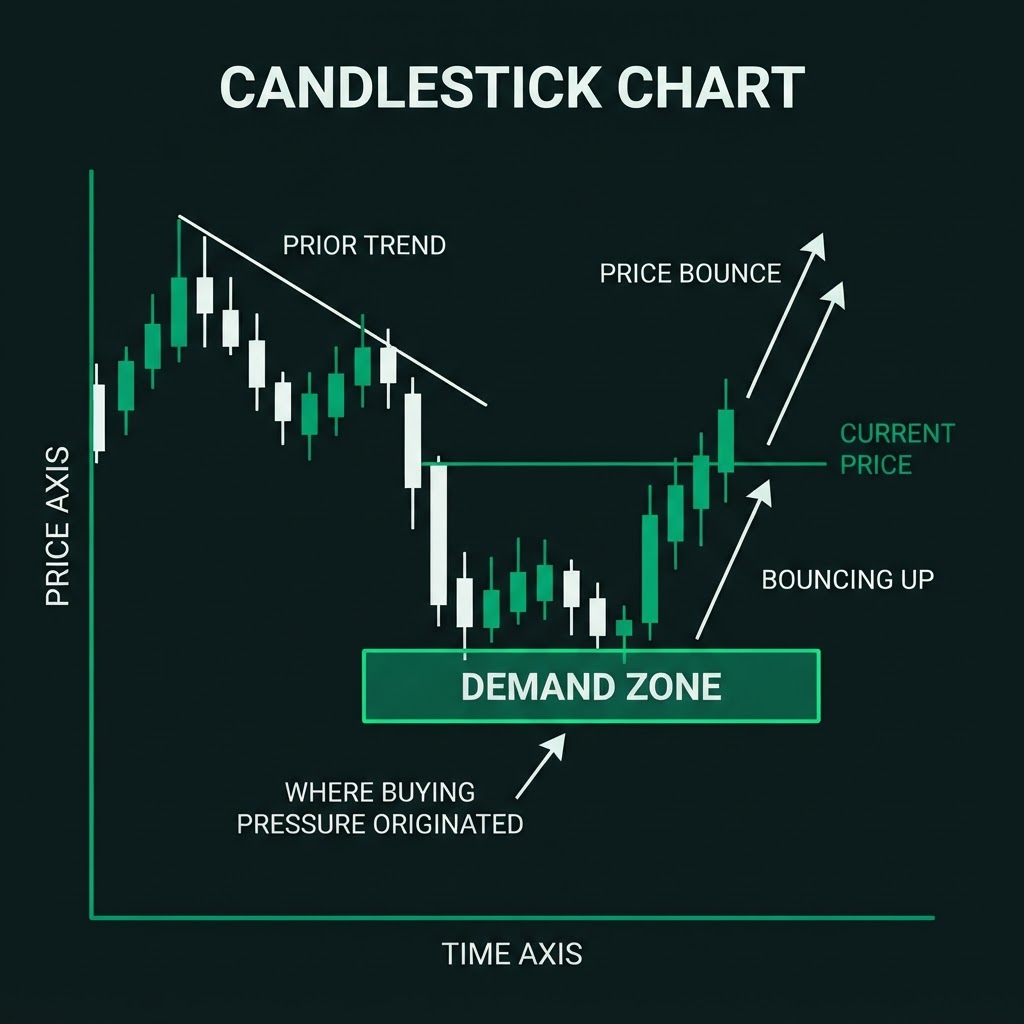
When price returns to a demand zone, buyers are likely to re-enter, pushing price up again. Demand zones are ideal areas for long (buy) opportunities.
How to Identify Supply and Demand Zones
Identifying zones is a skill that comes with practice. Here is a step-by-step process:
Step 1: Find Strong Moves (Imbalances)
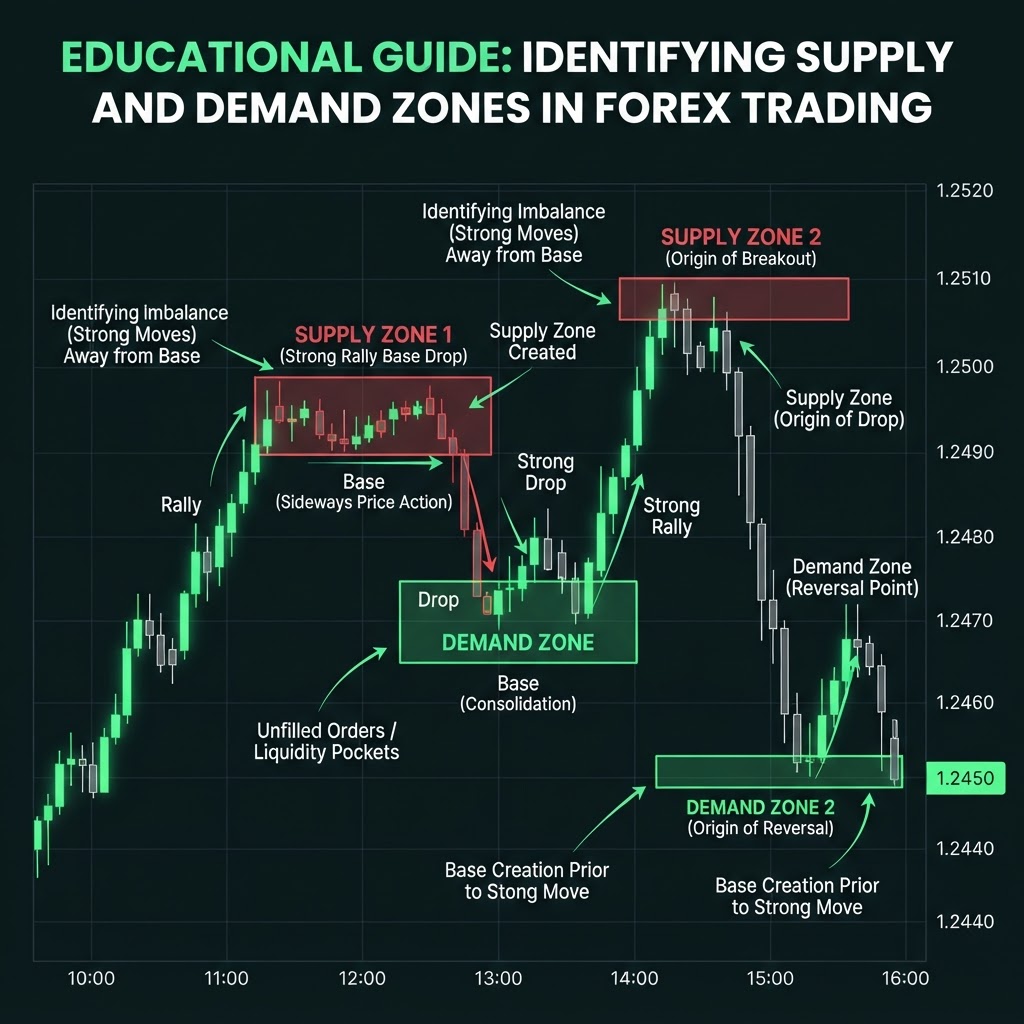
Look for areas on the chart where price moved very quickly in one direction — large candles, gaps, or a series of candles with little to no pullback. These strong moves indicate an imbalance between buyers and sellers.
Step 2: Identify the Base
Before every strong move, there is usually a consolidation — a small range of candles where price paused before exploding. This consolidation is called the base. The base is the zone itself.
Step 3: Draw the Zone
Draw a rectangle around the base candles. The top and bottom of the rectangle define the boundaries of the supply or demand zone. The zone extends forward in time until price returns to test it.
Step 4: Classify the Zone
- If the strong move was downward (sellers in control), the base is a supply zone.
- If the strong move was upward (buyers in control), the base is a demand zone.
Types of Zones
- 1Rally-Base-Drop (RBD): Price rallies, forms a base, then drops sharply. The base is a supply zone.
- 2Drop-Base-Rally (DBR): Price drops, forms a base, then rallies sharply. The base is a demand zone.
- 3Rally-Base-Rally (RBR): Price rallies, forms a base, then continues rallying. The base is a demand zone (continuation).
- 4Drop-Base-Drop (DBD): Price drops, forms a base, then continues dropping. The base is a supply zone (continuation).
How to Trade Supply and Demand Zones
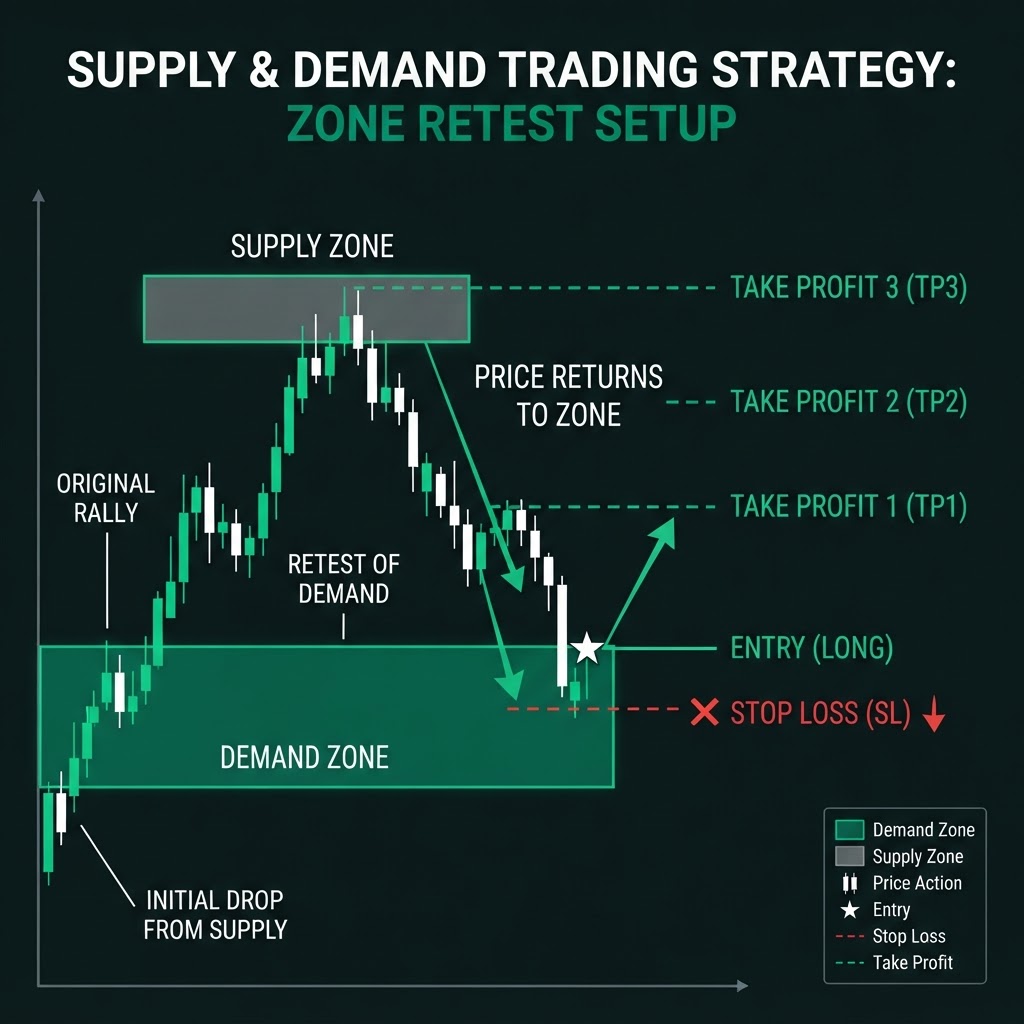
The core strategy is to wait for price to return to a zone and then enter a trade in the direction of the original move.
Entry Rules
- 1Identify a fresh zone: A zone that has not been tested yet is more reliable than one that has been tested multiple times.
- 2Wait for price to return: Be patient. Price may take hours, days, or weeks to return to the zone.
- 3Look for confirmation: When price enters the zone, look for a reversal candlestick pattern (pin bar, engulfing, etc.) or a lower-timeframe structure shift to confirm the zone is holding.
- 4Enter the trade: Place your entry order when confirmation appears.
Stop-Loss Placement
- For a demand zone (long trade): Place your stop loss just below the zone.
- For a supply zone (short trade): Place your stop loss just above the zone.
Take-Profit Targets
- Target 1: The most recent swing high/low.
- Target 2: The opposite zone (if one exists).
- Target 3: A measured move equal to the original impulse that created the zone.
Factors That Strengthen a Zone
Not all zones are created equal. Here are factors that make a zone more likely to hold:
- 1Strength of the original move: The stronger the move away from the base, the stronger the zone.
- 2Time spent away from the zone: The longer price has been away, the more likely institutional orders are still pending.
- 3Freshness: An untested zone is stronger than one that has been tested multiple times.
- 4Confluence: A zone that aligns with a trend, a key moving average, or a Fibonacci level is stronger than one in isolation.
- 5Timeframe: Zones on higher timeframes (4H, Daily, Weekly) are more reliable than those on lower timeframes (5m, 15m).
Common Mistakes
- 1Trading every zone: Not all zones are worth trading. Focus on fresh, strong zones with confluence.
- 2Entering without confirmation: Placing limit orders at zones without waiting for confirmation can lead to losses if the zone breaks.
- 3Ignoring the bigger picture: A demand zone in a strong downtrend is less reliable than one in an uptrend. Always consider the overall market structure.
- 4Holding through a zone break: If price breaks through a zone with a strong candle, the zone has likely been consumed. Exit and re-evaluate.
Conclusion
Supply and demand zones are one of the most powerful concepts in technical analysis because they go to the root of why prices move: imbalances between buyers and sellers. By learning to identify where institutions left their footprints and waiting for price to return to those levels, you can enter trades with tight risk and large reward potential. Like all trading skills, mastering supply and demand requires screen time and practice. Start on higher timeframes, identify clear zones, and trade them with discipline.